Interactive Data Dashboards
![]()
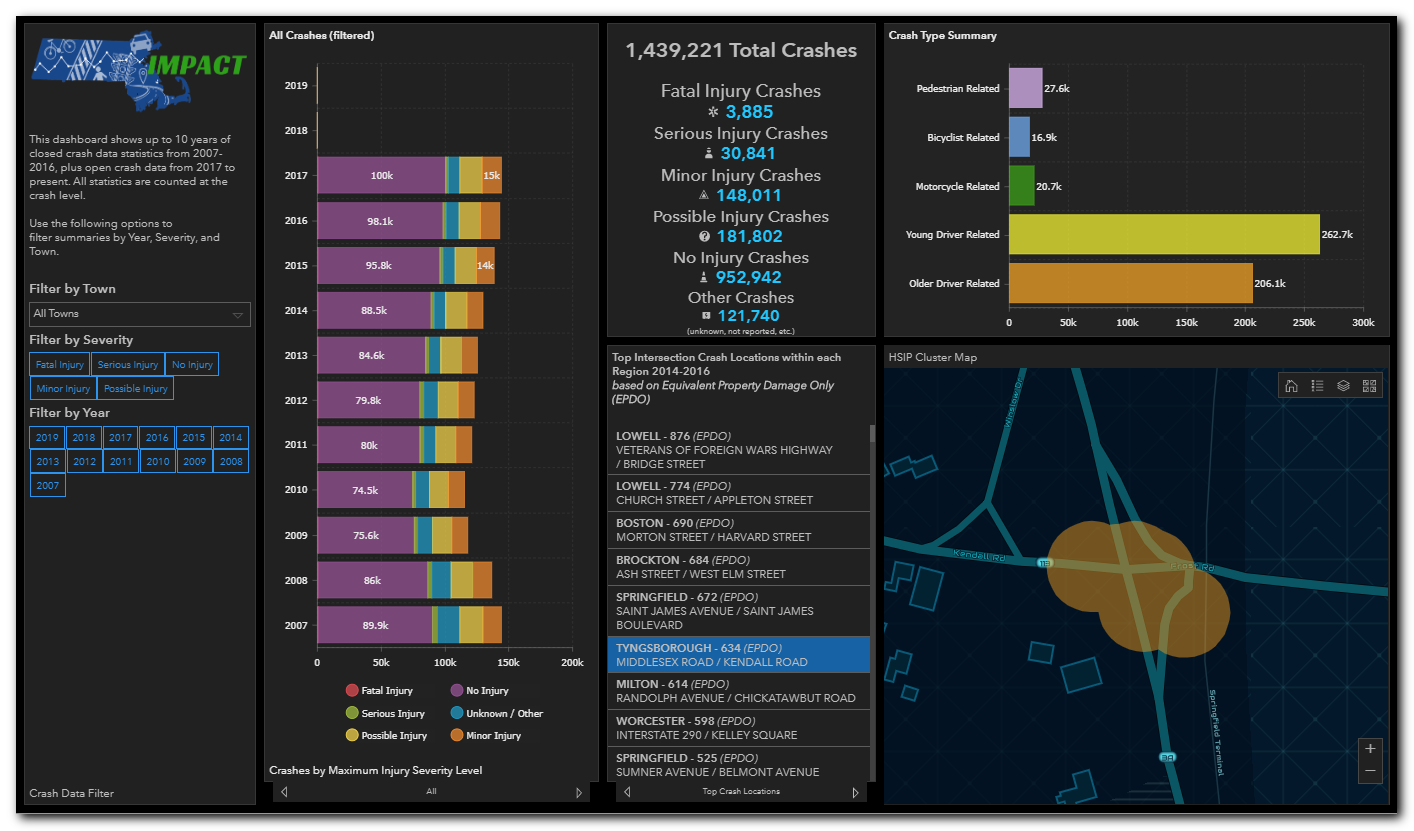
IMPACT dashboards tell powerful data stories using maps, charts and tables based on complex analyses. These pre-built dashboards allow for interactive analysis and data exploration specific to a given data theme in a range of categories.
To view the various dashboards:
1. Click the INTERACT button.
.png)
2. Select a category to view the available dashboards.
.png)
3. Select a dashboard to view.
.png)
4. Explore the dashboard. The dashboards are highly interactive, and you can manipulate them in a number of ways.
üView this topic to learn about Interacting with the Dashboards.

![]()
NOTE: Authorized users may have additional categories and dashboards that they can view.